The Creator Analytics That Actually Matter (and the Vanity Metrics to Ignore)
Stop chasing views and follower counts. Learn which creator analytics predict real growth and income, and how to review them in 30 minutes a week.
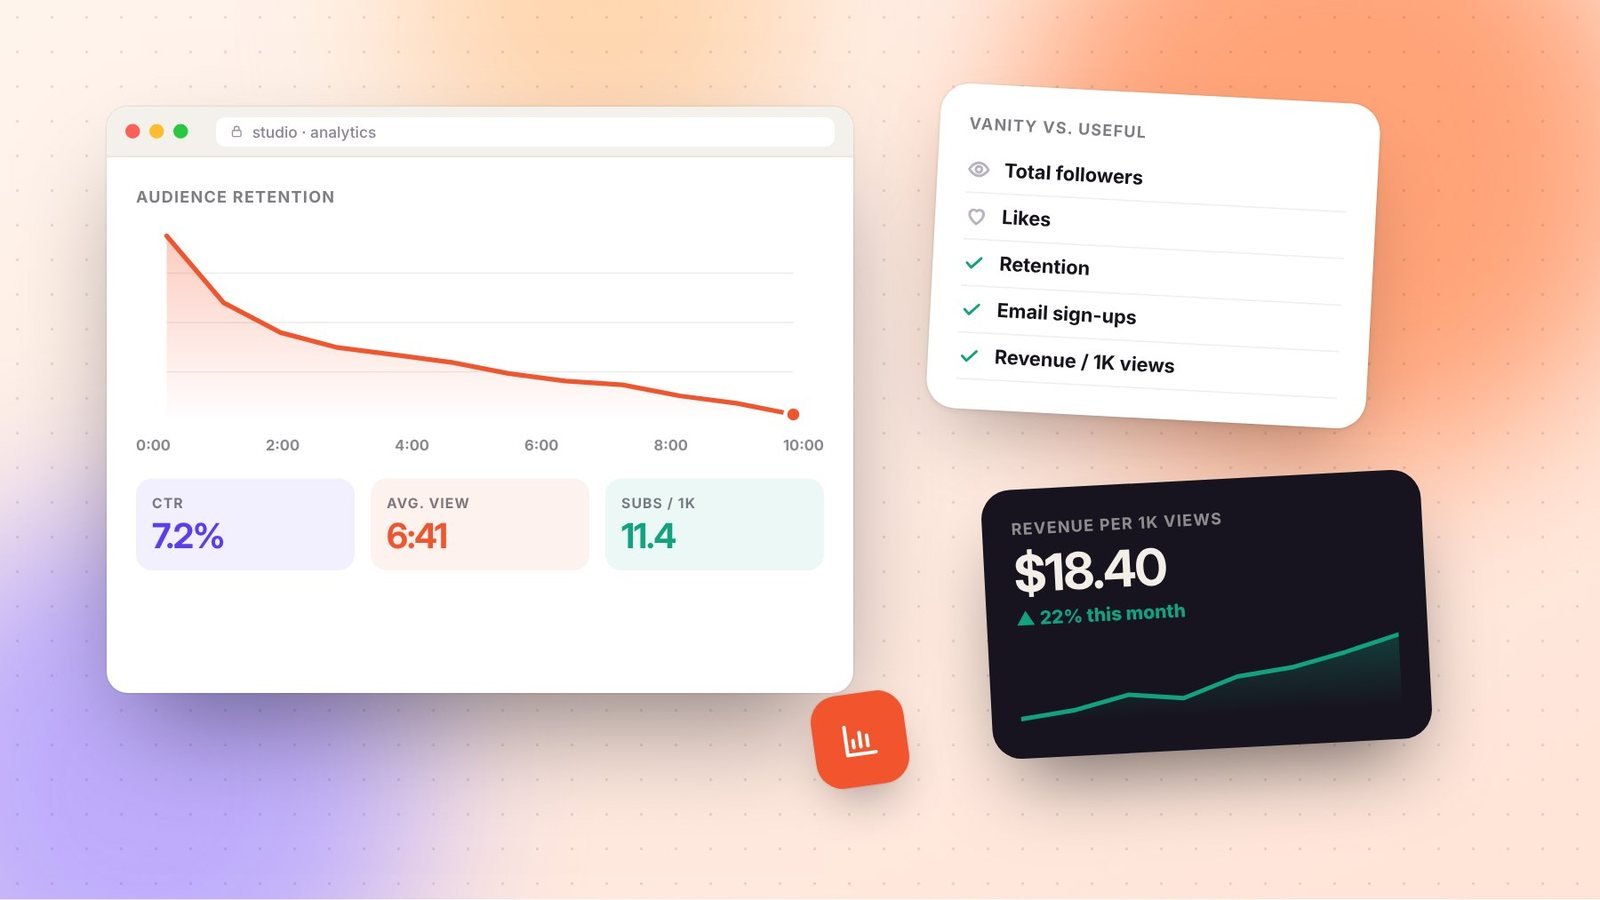
Every platform gives creators a dashboard full of numbers. It’s tempting to fixate on the biggest ones: views, followers, and likes. But those numbers often say little about whether your content is improving or whether your business is growing. A video can go viral and bring zero lasting fans. A modest post can bring dozens of email subscribers and a sale.
This guide explains which metrics deserve your attention, what they tell you, and how to build a simple weekly review habit.
Key takeaways
- Track metrics in three layers: attention, connection, and conversion.
- Retention and click-through rate show content quality; follows and subscriptions show connection; sales and sign-ups show business health.
- Compare against your own averages, not other creators’ numbers.
Vanity metrics vs. useful metrics
A vanity metric looks impressive but doesn’t guide a decision. A useful metric tells you what to do next. Total followers, lifetime views, and likes are mostly vanity metrics because they rise and fall for many reasons outside your control. They aren’t meaningless, since brands do look at audience size, but they shouldn’t drive your creative choices.
Layer 1: Attention metrics
Click-through rate (CTR)
On YouTube, impressions click-through rate shows how often people who saw your thumbnail clicked it. It measures how well your title and thumbnail match what viewers want. CTR naturally varies by traffic source and tends to drop as a video reaches broader audiences, so compare it with your channel’s typical range rather than a universal benchmark.
Retention and average view duration
Retention shows how much of your content people watch. The shape of your retention graph is often more useful than the average:
- A steep drop in the first 30 seconds suggests the opening doesn’t match the promise of the title, or it starts too slowly.
- Gradual decline is normal.
- Sudden dips mid-video point to a slow section, a confusing tangent, or a sponsor read that runs long.
- Spikes show moments people rewatch, which are good candidates for clips.
For newsletters and blogs, the equivalents are open rate, scroll depth, and time on page.
Layer 2: Connection metrics
Attention is borrowed; connection is earned. These metrics show whether people want an ongoing relationship with you:
- Follows or subscribers per 1,000 views. This tells you which content turns strangers into fans. Divide new follows from a piece of content by its views and multiply by 1,000.
- Returning viewers. YouTube shows new vs. returning viewers. A healthy channel grows both.
- Comments, shares, and saves. Saves and shares often signal genuine usefulness. Thoughtful comments matter more than emoji replies.
- Email replies. In a newsletter, replies are one of the strongest signals of trust.
Layer 3: Conversion and business metrics
This is where content turns into a sustainable business:
- Email sign-ups by source. Which videos or posts send people to your list? Use different links or sign-up forms per source to find out.
- Link clicks and conversion rate. Of people who click to your product page, how many buy?
- Revenue per 1,000 views. Add up all income tied to a piece of content, including ads, affiliate commissions, sponsorships, and product sales, and divide by views. This shows which topics are actually valuable to your business.
- Customer lifetime value. How much does a typical customer spend with you over time? It tells you how much effort you can spend to acquire one.
A simple scorecard
| Question | Metric to check | What to do if it’s low |
|---|---|---|
| Are people choosing to watch? | CTR, open rate | Test new titles, thumbnails, subject lines |
| Is the content holding attention? | Retention, scroll depth | Tighten intros, cut slow sections, deliver the promise sooner |
| Do viewers want more? | Follows per 1,000 views, returning viewers | Clarify your niche, add series and next-step calls to action |
| Is it growing the business? | Email sign-ups, revenue per 1,000 views | Create content that leads naturally to your offers |
The 30-minute weekly review
Set a recurring calendar block and follow the same steps each week:
- List last week’s content in a spreadsheet with views, CTR, retention, follows, and conversions.
- Mark your top and bottom performer based on follows or conversions, not views.
- Write one sentence on why you think each performed the way it did.
- Choose one experiment for next week, such as a new hook style, a different thumbnail approach, or a new call to action.
Over time, this log becomes a personal playbook more valuable than any generic advice, including ours.
Avoid these analytics traps
- Checking too often. Refreshing stats hourly increases anxiety without improving decisions. Most content needs at least a few days of data.
- Comparing to outliers. Someone else’s viral hit is not your benchmark. Your own trailing average is.
- Changing too much at once. If you change the topic, format, length, and thumbnail style simultaneously, you won’t know what made the difference.
- Ignoring qualitative feedback. Comments, DMs, and replies explain the “why” behind the numbers.
Good analytics habits turn content creation from guesswork into a learning system. Focus on the few numbers that connect to real fans and real revenue, and you’ll make better decisions with less stress. When you’re ready to turn that attention into income, start with our guide to monetizing a small audience.
Frequently asked questions
How often should I check my analytics?
A focused weekly review is enough for most creators, plus a deeper monthly look at trends. Checking hourly tends to increase anxiety without improving decisions, because most content needs several days of data before patterns are meaningful.
What is a good engagement rate?
It depends heavily on platform, niche, format, and audience size, so there’s no universal benchmark. The most useful comparison is your own trailing average. If a piece performs well above your norm, study what made it different.
Do brands care about my analytics?
Yes. Brands increasingly look at average views, engagement, audience demographics, and past campaign results rather than follower counts alone. Keeping clean records of your metrics makes it easier to build a media kit and justify your rates.